Evaluation of Scaling the New Orleans Charter Restart Model:

Learn More About Student Impact

image description Impact Methods: Explore what we did

In order to dig more deeply into the Student Impact findings regarding fresh start schools and full school turnarounds, we examined student demographic characteristics as well as certain school characteristics to determine whether these factors accounted for any of the observed differences in performance between fresh starts and full school turnarounds.

Student Demographics
Black
95%
Fresh Start Schools
89%
Full School Turnarounds
Hispanic
3%
Fresh Start Schools
6%
Full School Turnarounds
English Language Learners
3%
Fresh Start Schools
7%
Full School Turnarounds
Special Education
13%
Fresh Start Schools
13%
Full School Turnarounds
Free Lunch
87%
Fresh Start Schools
88%
Full School Turnarounds

Fresh start schools and full school turnarounds are similar in terms of racial composition, percentage of English Language Learners, and percentage of Special Education students. Fresh start schools are likely to have fewer students eligible for Free/Reduced Price Lunch, although this difference is not statistically significant.

Baseline Performance
Mathematics
To examine the performance of students as they first entered CRM schools, we categorize first-time enrollments in CRM schools in two ways: students who attended the Closing school and continue in the CRM school (Persisters) and students who attend the CRM school but did not attend the Closing school (New Entrants). This graph compares the baseline achievement in math of students attending fresh start schools and full school turnarounds in the schools' first years of operation. New Entrants in full school turnarounds had a stronger baseline achievement than New Entrants in fresh start schools, but Persisters (who can only exist in full school turnarounds) had weaker baseline achievement than New Entrants in either type of CRM school. Overall, then, students who enrolled in fresh start CRM schools had a significantly higher baseline achievement in math at entry, compared to students in CRM full school turnarounds.
Reading
Findings regarding students' starting performance in reading differ from that in math. We find that fresh start students had weaker baseline achievement in reading compared to students in full school turnarounds. Although New Entrants in fresh start schools had the same performance at entry as Persisters in full school turnarounds, the New Entrants in full turnarounds had much higher performance levels at entry. By virtue of this higher performance level of New Entrants entering full school turnarounds, overall entry performance was higher in full school turnarounds than in fresh starts in reading.
Student Growth Over Time
Mathematics
Fresh start CRM schools exhibit higher growth effects in math for the first through fourth years of operation compared to full school turnarounds. Only a single fresh start school opened in 2011-12, so data on fifth-year fresh starts comes from that school alone.
Reading
Fresh start CRM schools exhibit higher growth effects in reading for the first through fourth years of operation compared to full school turnarounds. Note that fresh start students entered their CRM schools with much weaker reading scores compared to those students entering full turnarounds, but that fresh start schools close this gap within one year of operation.
Operational Factors
Local CMO
Reading
154
Math
171

Students in CRM schools operated by a CMO from the local community exhibit on average 154 additional days of learning in reading and 171 additional days of learning on average in math, compared to students in CRM schools operated by non-local CMOs. Fresh start schools were more likely to be operated by a local CMO.

Board Activity
Reading
-205
Math
-245

Board activity, defined by number of meetings per year, is negatively associated with student learning, perhaps because boards of struggling schools feel the need to meet more frequently. Having an additional board meeting in a given year is associated with 205 fewer days of learning for each student on average in reading and 245 fewer days of learning for each student on average in math. Fresh start schools had less frequent board meetings compared to full school turnarounds.

Principal Turnover
Reading
-57
Math
-188

Eleven CRM schools experience at least one leadership turnover during the course of the evaluation. Having a principal turnover in a given year is associated with 57 fewer days of learning in reading for each student on average and 188 fewer days of learning in math for each student on average, although only the math finding is statistically significant here.

Performance Management Organization Rubric Scores
Fresh Start Schools
Reading
274
Math
29

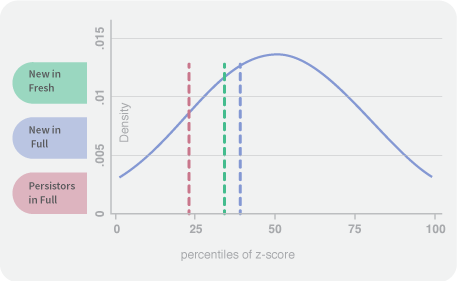
An increase of one increment on the PMO scale is associated with 274 additional days of learning in reading and 29 additional days of learning in math for students in fresh start CRM schools. Fresh starts are found to have a significantly higher PMO scores than full school turnarounds, suggesting higher implementation quality in the fresh start CRM schools. Additionally, the association between PMO score and growth is stronger for fresh starts than for full school turnarounds.

Full School Turnarounds
Reading
234
Math
17

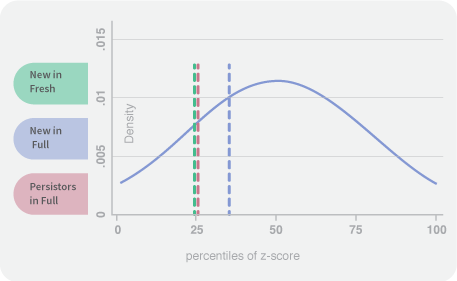
An increase of one increment on the PMO scale is associated with 234 additional days of learning in reading and 17 additional days of learning in math for students in CRM full school turnarounds.

Go back to the main Student Impact page or explore the impact data by individual states: Louisiana and Tennessee