
Our Research Questions
Brief Overview of the PMO
The PMO is built around 14 functions that effective schools master. Each function demands focused strategy and consistent implementation over time. Over the five years of school visits, questions were included in field protocols to capture point-in-time snapshots of school effort in the various functional areas. Each school was asked the same questions at the same maturation points. It should be noted that schools that were turned around in the later years of the project had fewer years of experience to study, and thus lack the deeper foundations for assessment as earlier schools. Counteracting that weakness is the finding that older turnaround schools did not show substantial movement from year to year in their ratings.
In each of the 14 areas, school personnel responses and field researcher observations were rated, compiled and the final sum transformed to a scale of zero to 100%. Each of the 14 scores was mapped to the rubric separately.
| Rubric Score | PMO Stage | Minimum | Maximum |
|---|---|---|---|
| 0 | Absent | 0% | 32% |
| 100 | Developing | 33% | 64% |
| 200 | Accomplished | 65% | 84% |
| 300 | Exemplary | 85% | 100% |
Each area was assessed independently; high scores in one area could not be used to offset scores in others. Once a school had its individual area ratings, those 14 area scores were averaged and the result was the school’s overall PMO score.
The final total scores show each school’s overall organizational capacity to allocate and manage resources to produce positive results. Consistent with the CRM Theory of Action, when aggregated, PMO rubric scores also reflect the output of effort by school teams, CMO leadership and systems level partners to support the turnaround experience to achieve its overall objective of high quality seats.
For more information about how the PMO Rubric is constructed, click here
PMO Findings
 When all 21 schools were considered in the aggregate, their average score of 200 placed them in the Accomplished category overall. The average spans a school with a score of 107 (marginally Developing) to a school that posted a 257. At the individual school level, the PMO suggests substantial dierences in the organizational focus of the schools.
PMO Scores by Locale
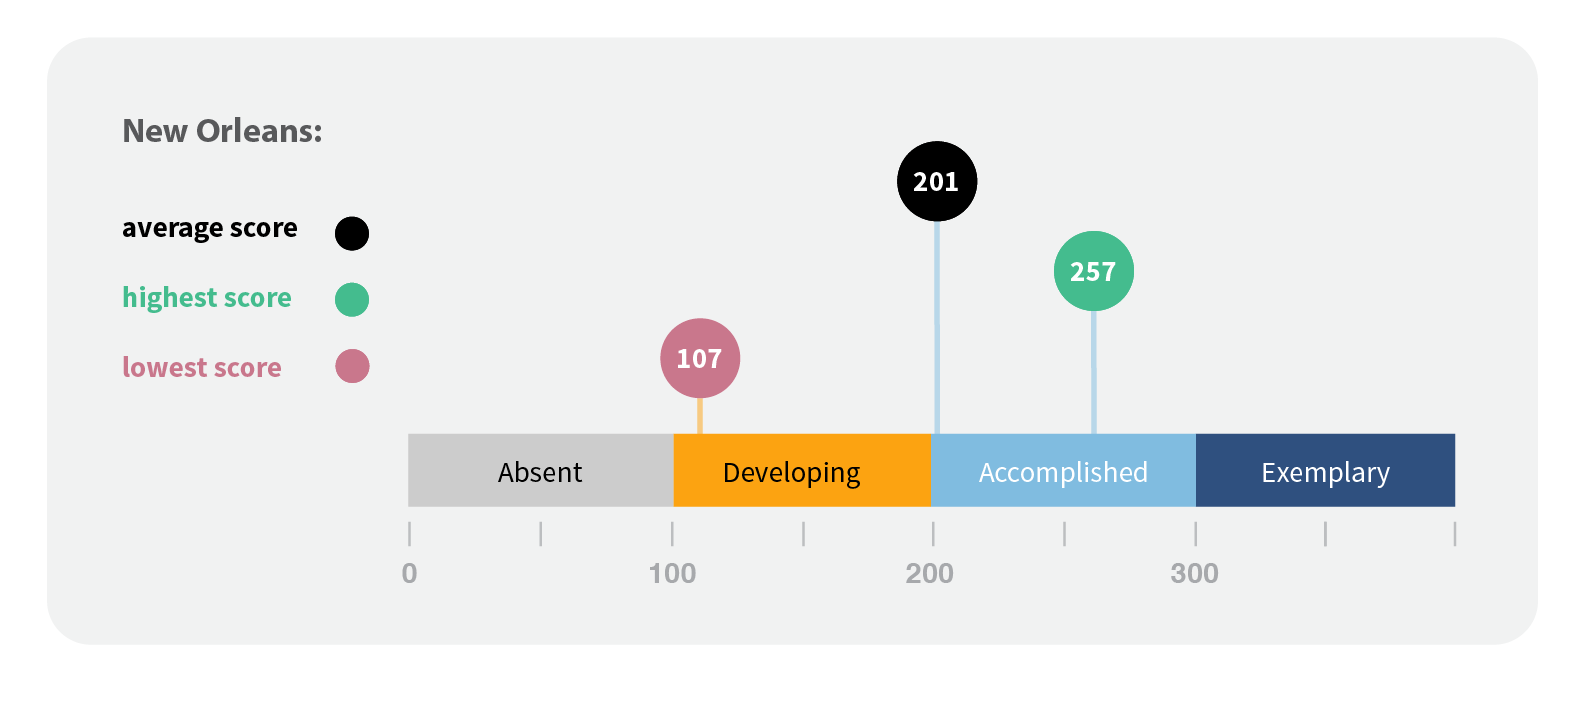
 This overall average rating was upheld for both the 13 New Orleans schools and the eight schools in Tennessee when considering scores by state. The averages for each group are rated Accomplished but just barely so. However, the spread between worst and best is wider in New Orleans than seen in Tennessee. The worst school in New Orleans schools fell at the low end of Developing, indicating that this lowest-scoring New Orleans school is therefore less equipped to produce high levels of quality than the lowest-scoring CRM school in Tennessee. The converse is also true: New Orleans had schools that outscore even the best Tennessee school on the rubric.
PMO Scores by Opening Year
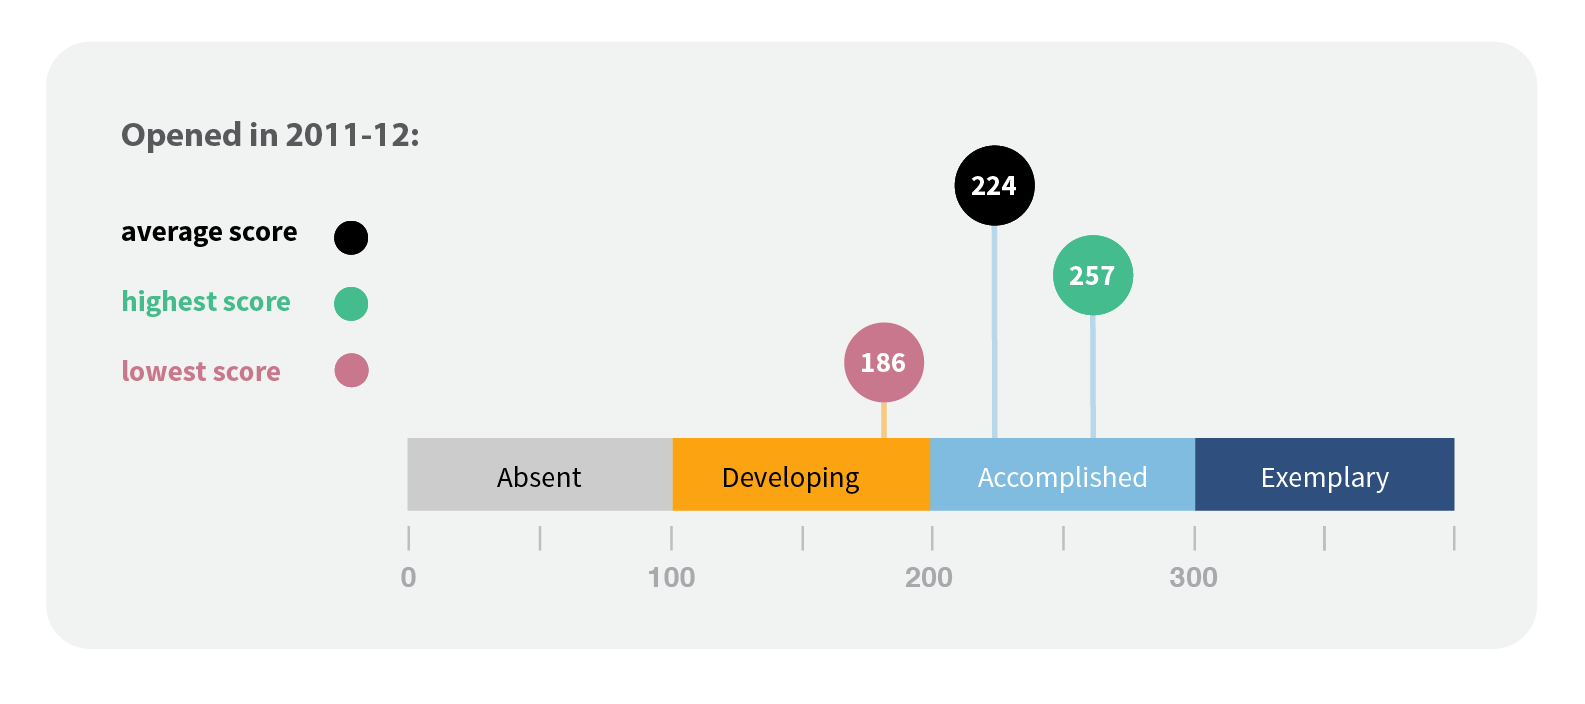
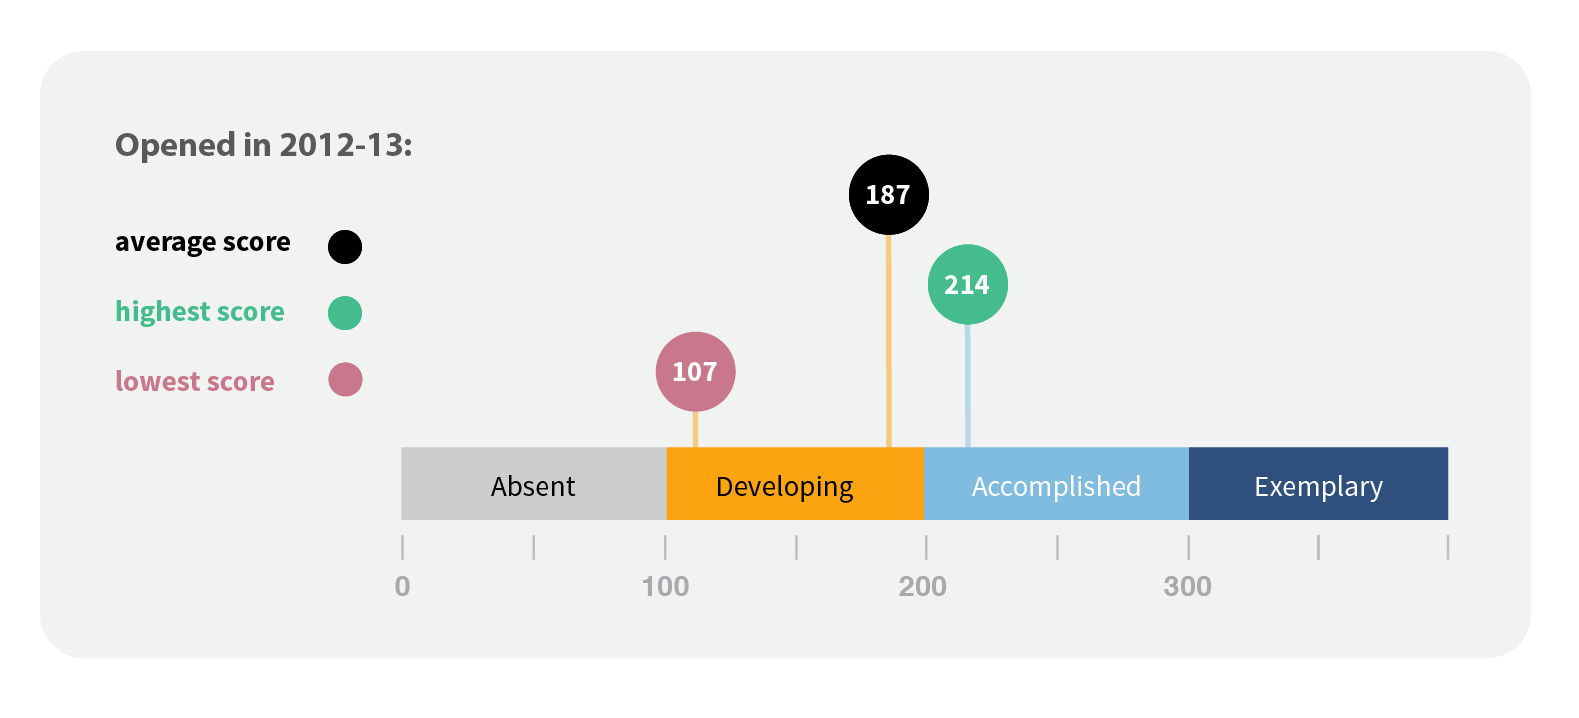

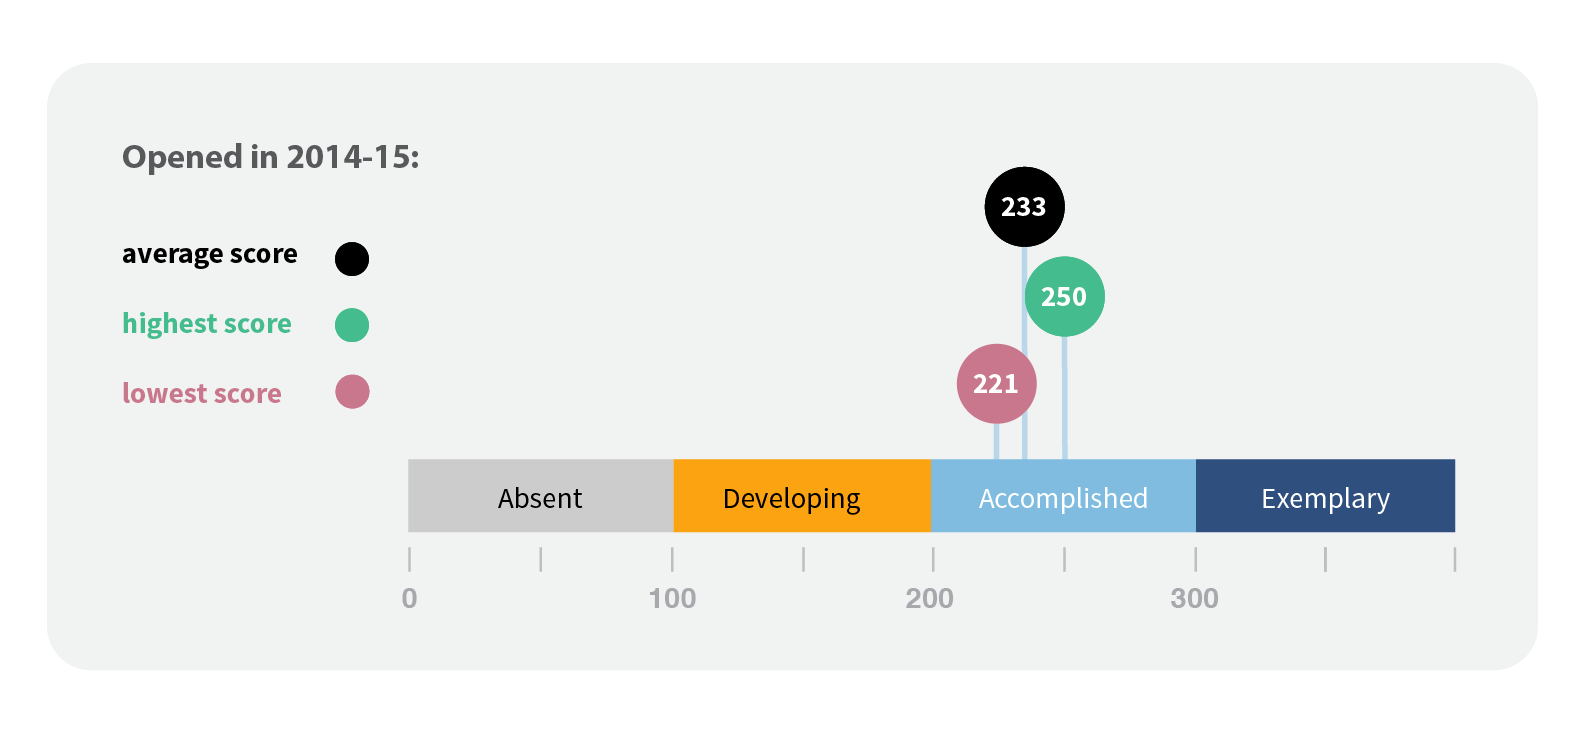 The schools were grouped by opening year (regardless of location) and their average PMO scores compared. The newest group opened in 2014-2015 and, despite having fewer years of operation, posted the highest PMO scores: all the schools were rated at the Accomplished level. The lowest scoring school in that group outpaced all the other groups’ lowest scorers and their highest scoring was close to the top of all schools. The oldest group of schools on average were rated by the PMO rubric as Accomplished; this group included the highest scoring school overall. The middle groups had lower overall scores throughout – rated as Developing -- and reinforce the story of CMO selection over the project period.
PMO Scores by Grades Served
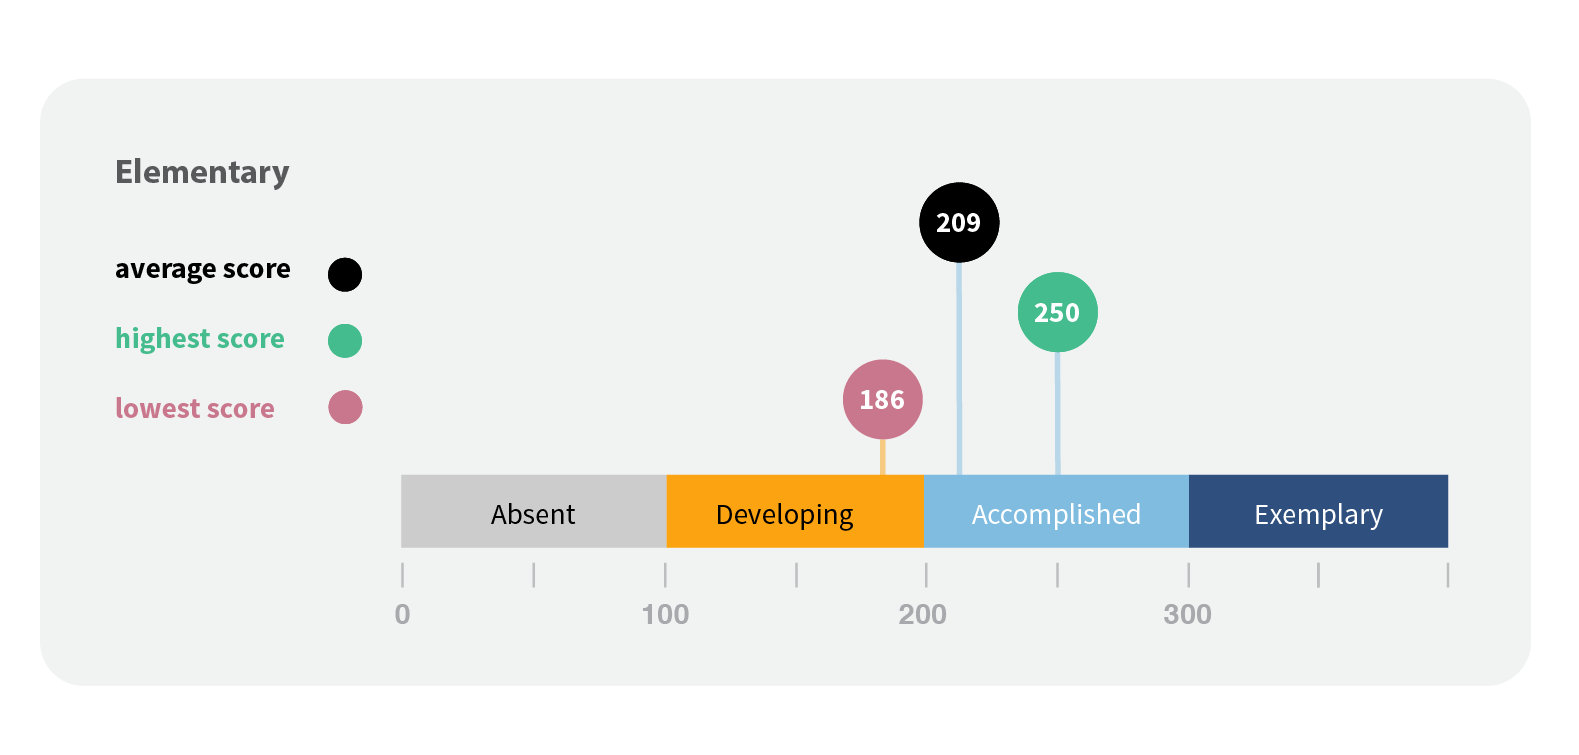
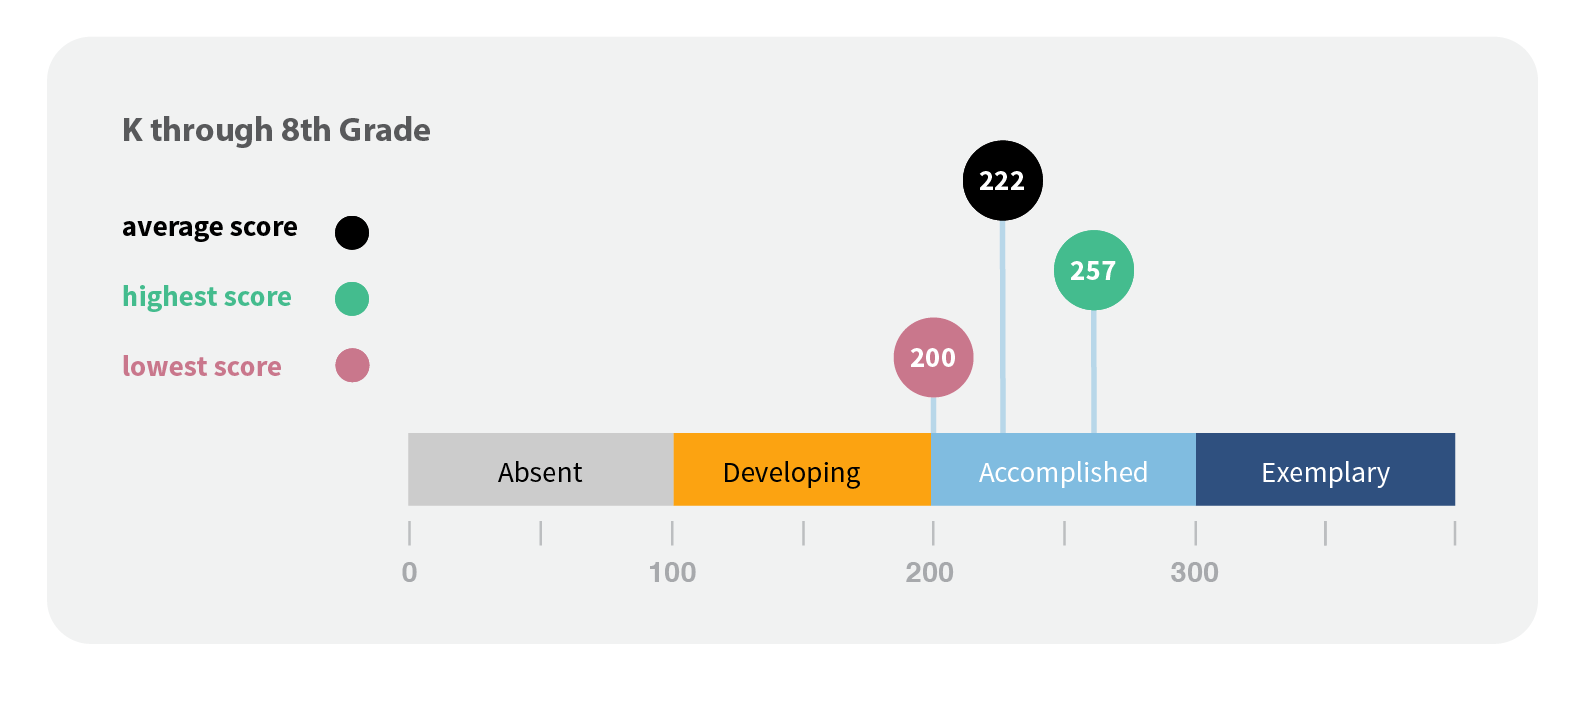
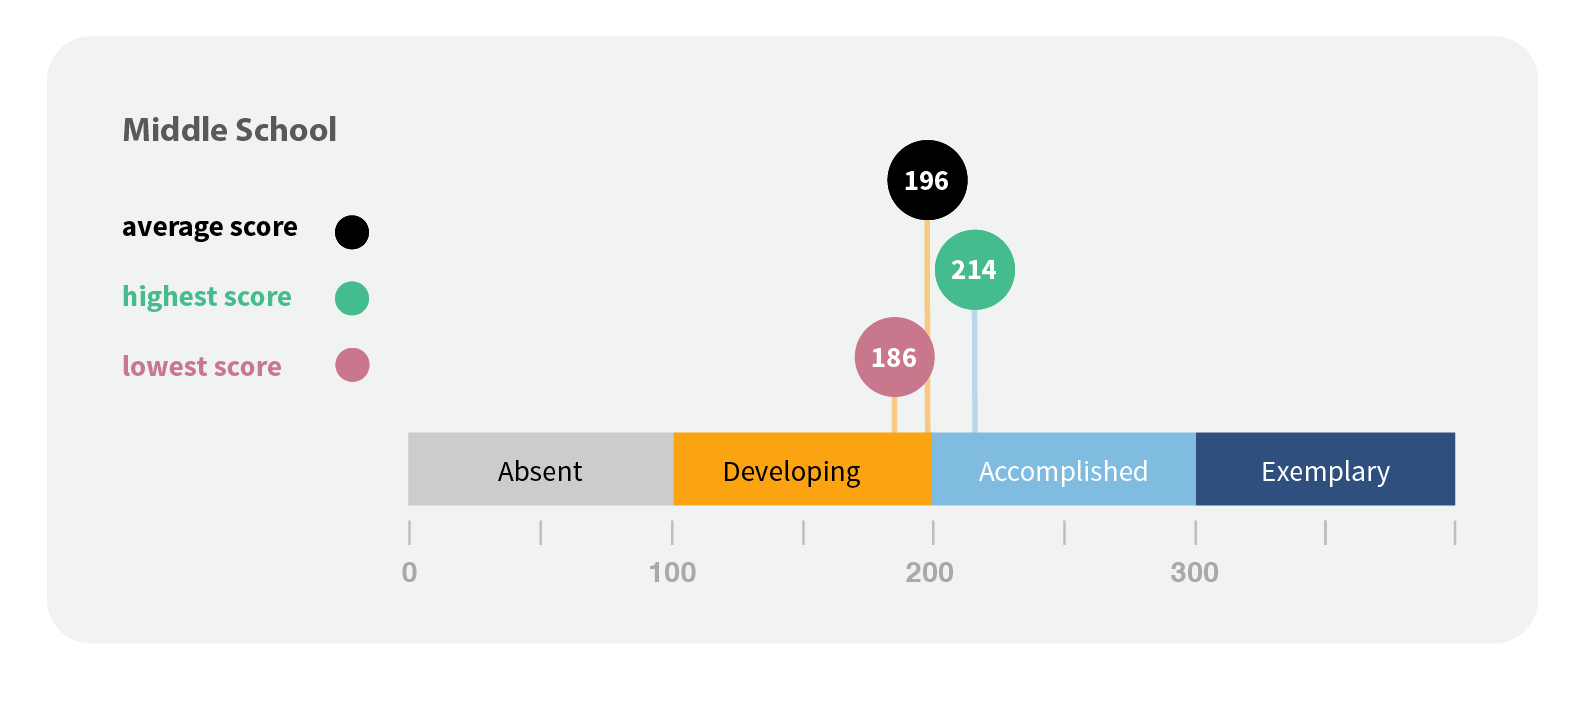
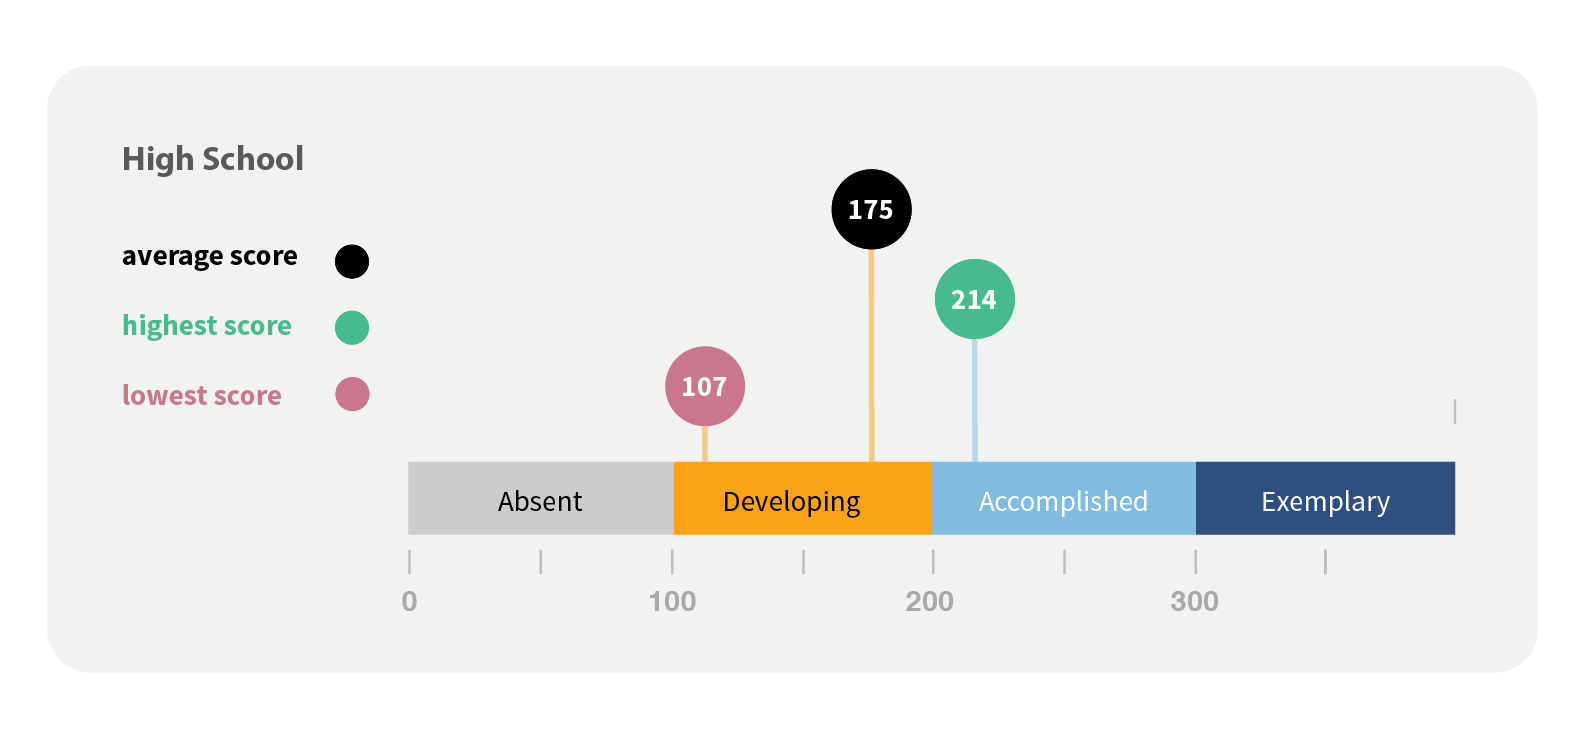 When grouped by grades served, the differences in organizations’ evidence of successful performance practices intensifies. Elementary schools and K-8 schools on average scored in the Accomplished range, but the typical middle school or high school was rated as Developing. Even the highest performing high schools in both locales fell considerably below highest ratings in the other groups.
 PMO Scores by Turnaround Strategy: Full Restart or Fresh Start
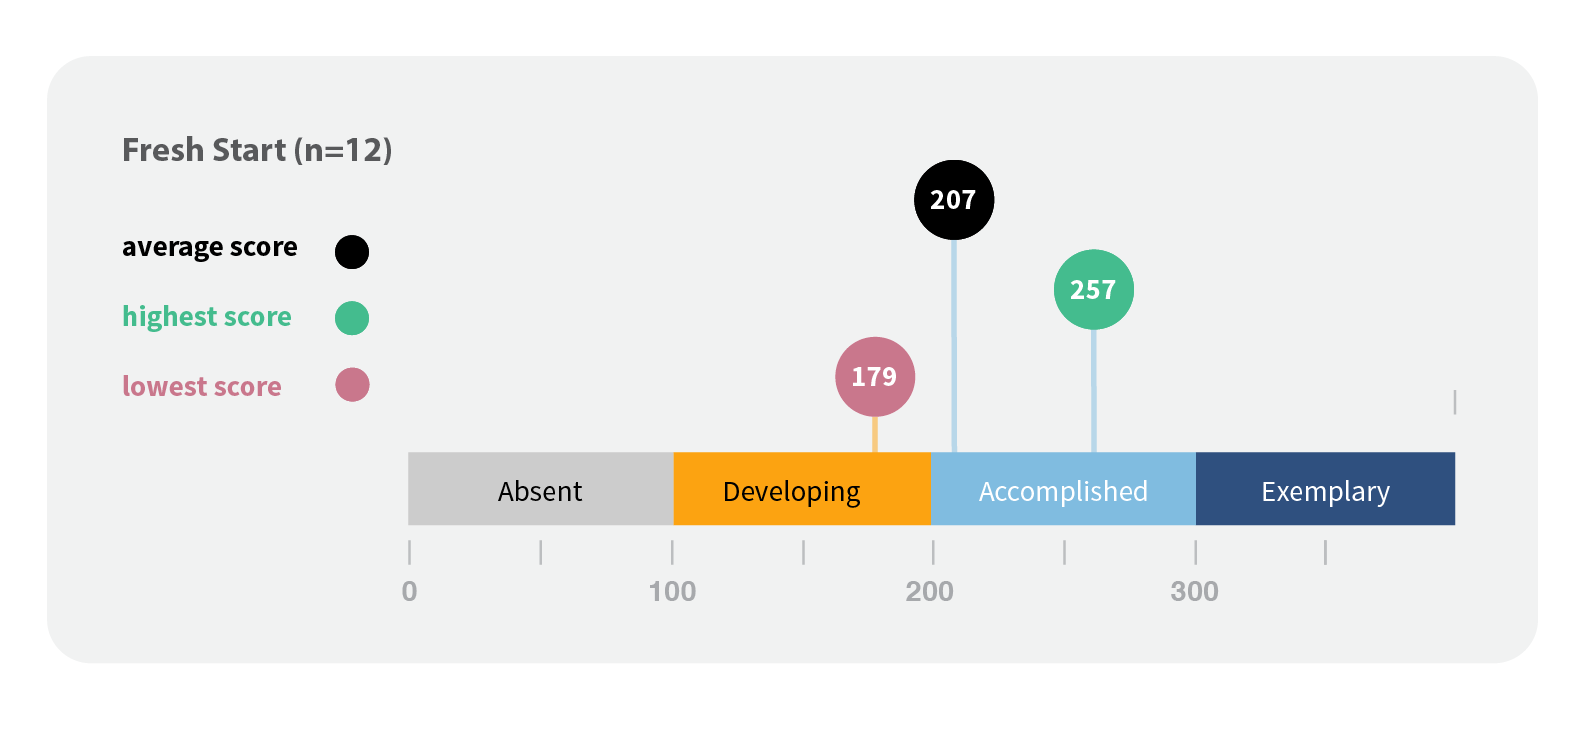
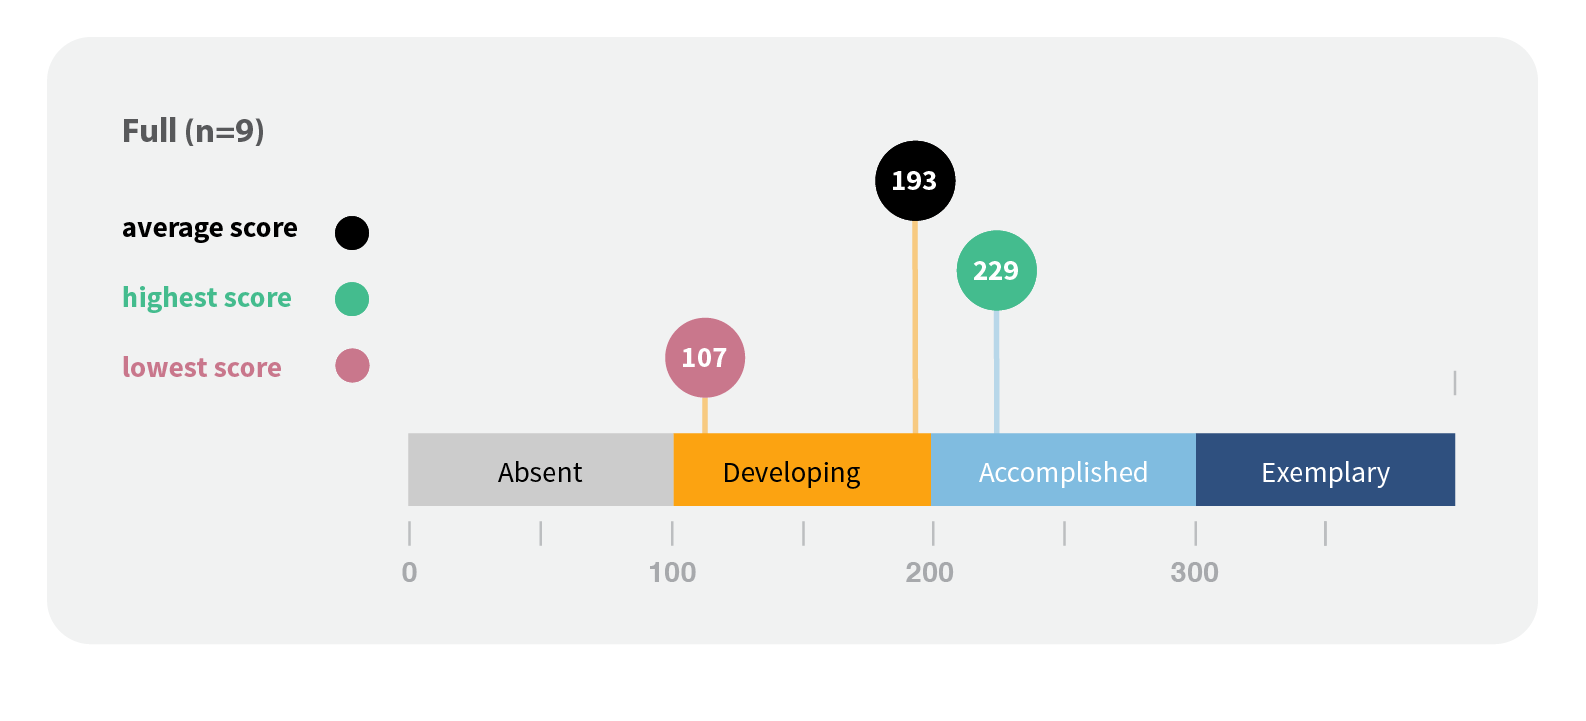 Some schools were granted the option to restart their school with a new class in their lowest grade and add a grade or more a year thereafter. Schools were grouped by their turnaround strategy to see if the PMO rubric revealed differences between these groups. In all respects, the schools that began with a Fresh Start strategy outperformed those who pursued full turnarounds. On average, Fresh Start schools were rated as Accomplished while Full Restarts earned an average rating of Developing. The worst Fresh Start school had a PMO score that fell in the Developing range but was still substantially larger than the lowest Full Start school. Interestingly, the best schools in each group were not profoundly different, both squarely in the Accomplished category. These figures mirror the findings elsewhere that highly functional, performance oriented schools could emerge under most sets of conditions, but they were not common.